
下载
官网下载并解压:https://www.qcustomplot.com/
使用
创建一个QMainWindow应用,注意添加Print Support模块(.pro中
Qt += printsupport);
将
qcustomplot.h和qcustomplot.cpp复制到项目目录,并添加到项目中;添加代码如下:
#ifndef CPLOT0_H
#define CPLOT0_H
#include <QtWidgets/QMainWindow>
#include "ui_cplot0.h"
#include "qcustomplot.h"
class cplot0 : public QMainWindow
{
    Q_OBJECT
public:
    cplot0(QWidget *parent = 0);
    ~cplot0();
    void simpledemo(QCustomPlot *customPlot);
private:
    Ui::cplot0Class ui;
};
#endif // CPLOT0_H
#include "cplot0.h"
#include <QVector>
#include <QtMath>
cplot0::cplot0(QWidget *parent)
: QMainWindow(parent)
{
ui.setupUi(this);
this->setCentralWidget(ui.widget);
simpledemo(ui.widget);
}
cplot0::~cplot0()
{
}
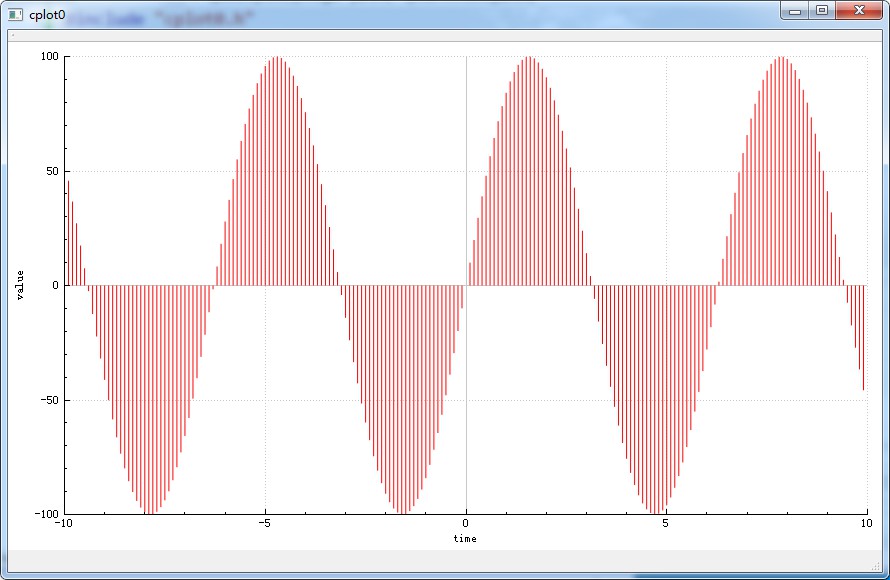
void cplot0::simpledemo(QCustomPlot *customPlot)
{
QVector<double> x, y;
for (double i=-10; i <= 10; i=i+0.1)
{
double x1 = i;
double y1 = qSin(i) * 100;
x.append(x1);
y.append(y1);
}
customPlot->addGraph();
customPlot->graph(0)->setPen(QPen(Qt::red));
customPlot->graph(0)->setLineStyle(QCPGraph::lsImpulse);
customPlot->graph(0)->setData(x, y);
customPlot->xAxis->setLabel("time");
customPlot->yAxis->setLabel("value");
customPlot->xAxis->setRange(-10, 10);
customPlot->yAxis->setRange(-100, 100);
}